Analyzing GPS Data
- GH Feedback 3/26/16: would be cool to have nyc image in snap!
Big Burgers wants to answer this key question: where should the new restaurant be? By visualizing the 223 data points, they've learned new information about their customers.
-
Import the
average block you built in Unit 3 into your current project:
- Starting from the Unit 3 project, in Snap!, choose "Export blocks..." from the File menu.
- Right-click on any check mark and choose "none" to de-select all the blocks, then hit OK.
- Find and click on the
average block, then click OK. This will generate an XML file.
- In your current project, choose "Import..." from the File menu, then select the XML file you just generated.
- The
average block should now be usable in your current project.
- Use the
average block to compute the average latitude and average longitude of the GPS data.
- Plot the average as a new data point using the same scaling as the other points.
- Would this be a good location for the restaurant? Explain.
Here's a visualization of the GPS data, along with some latitude lines for reference. The GPS data breaks into three clear zones:
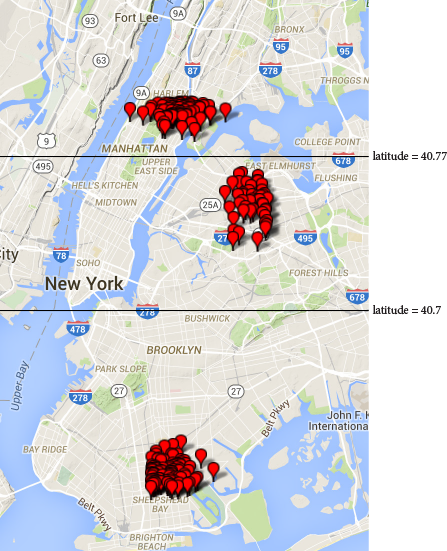
Based on the visualization, Big Burgers will place their restaurant in the zone with the largest number of customers. But, which one is it?
Taking a large data set and breaking it into smaller groups is called cluster analysis. Visualizations of data are especially helpful in identifying and classifying clusters.
- Given a specific pair of GPS coordinates, how might you decide which of the three zones it is in?
- Create a
zone block. The input is a pair of GPS coordinates, and the output indicates which zone the coordinates are in.
- Use the
zone block and the full set of GPS data to determine which of the three zones has the most customers.
Now that Big Burgers knows the general area to place the restaurant, they still need to determine where within that zone to place it. To do this, they need a new list of the GPS coordinates of those customers within that zone.
 What blocks might be helpful here?
- Use the
average block to compute the average of all the longitudes and latitudes of the GPS data within the most popular zone.
- On a map, find the location where the data says the restaurant should be located. What practical limitations might there be to this analysis?
- Big Burgers decides they can open two restaurants in New York. Where should the second restaurant be located?