 when working with large data sets, giving people the opportunity to study what might otherwise be incomprehensible. This map from YesYesNo was generated from runners contributing their tracking data.
What about data with millions of pieces of information, instead of a few hundred? Large data sets present challenges and opportunities for discovering new information.

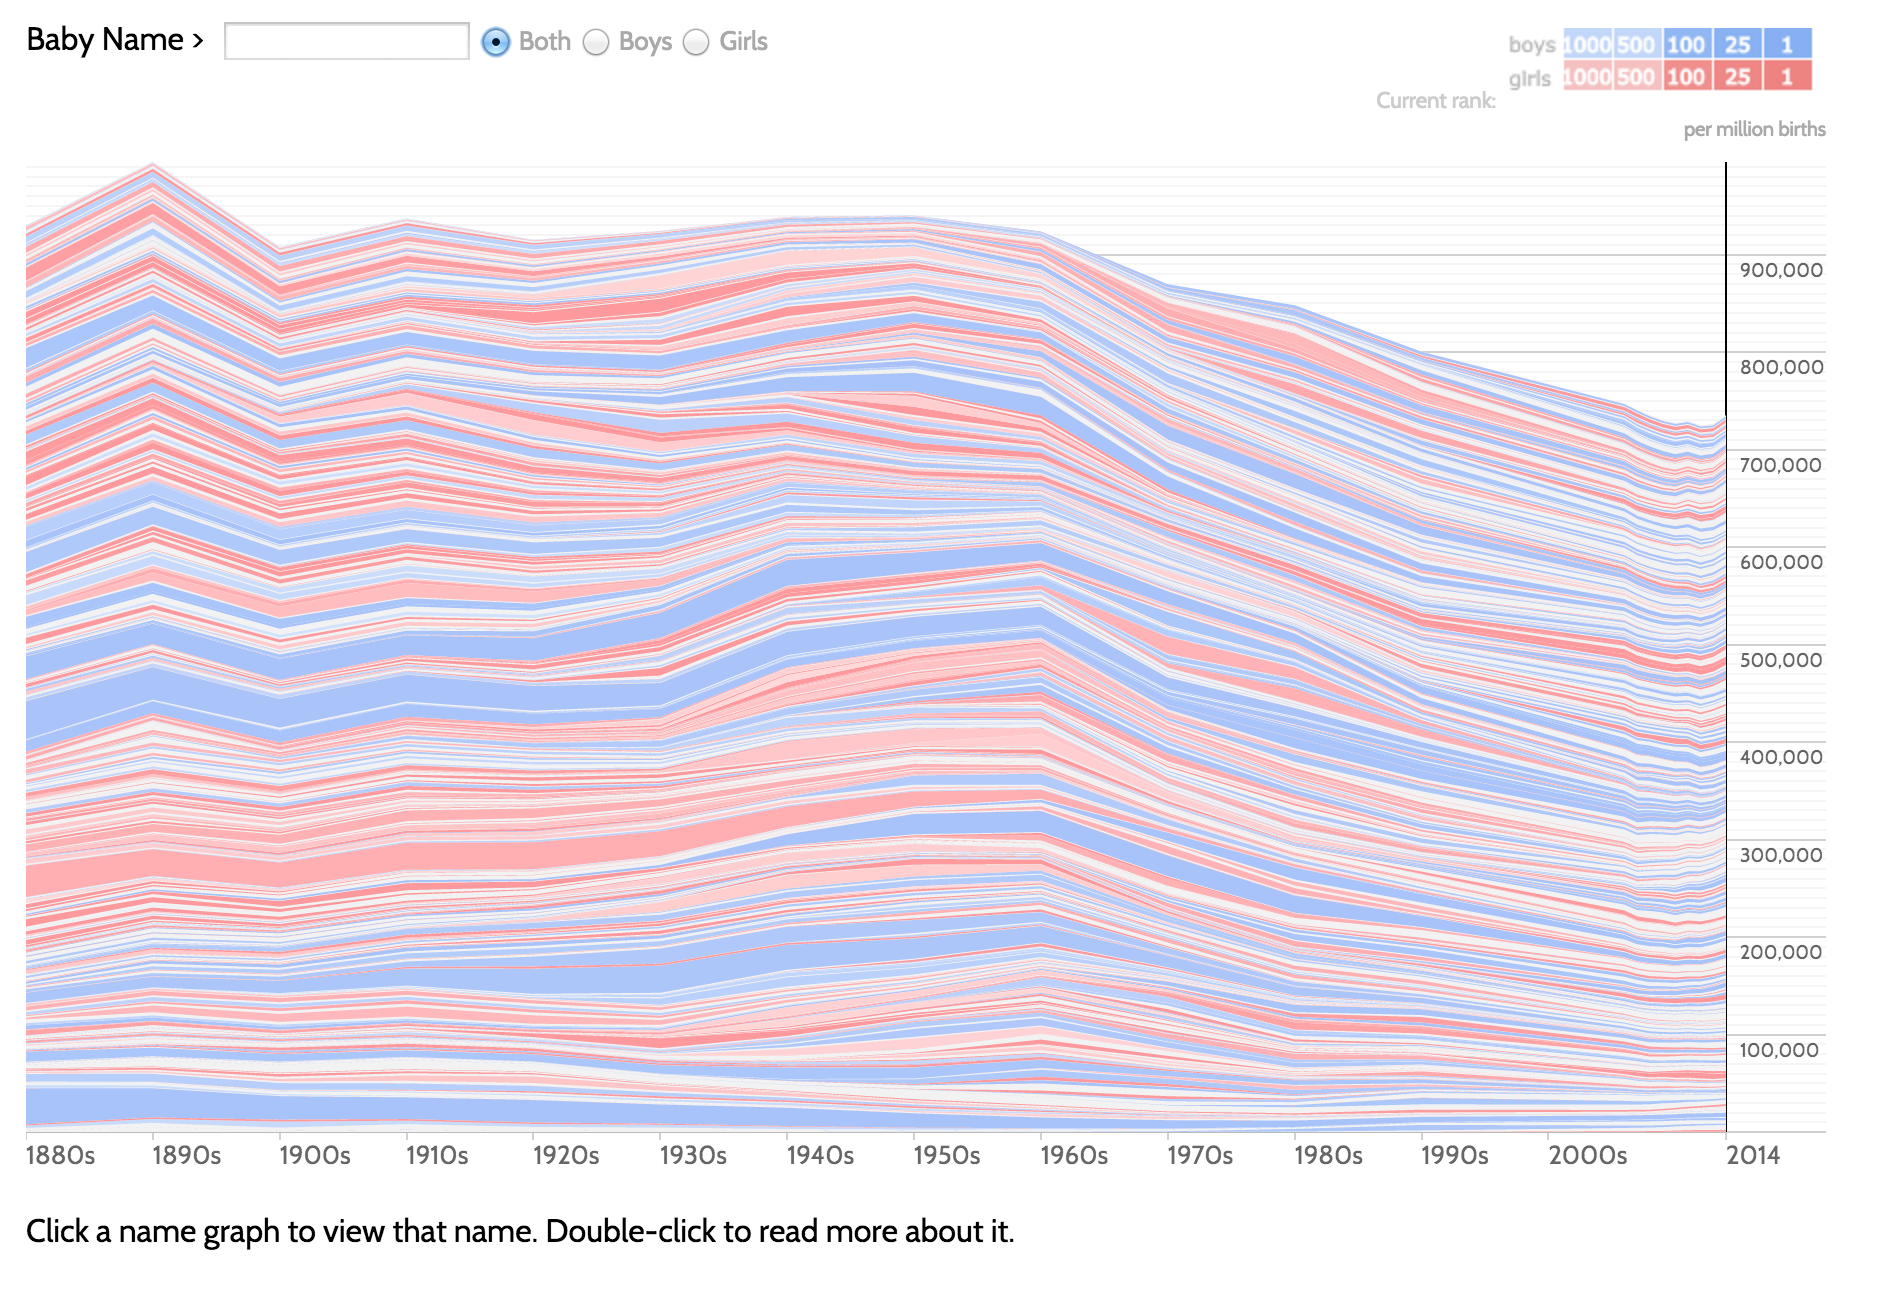
The Baby Name Voyager is an impressive visualization of a large data set. This data comes from the Social Security Administration, a text file for each year from 1880 to 2014. Very few of the insights in this data would be learned just from reading these files!
Large data sets present unique challenges and opportunities:
Visualizations and interactive tools are especially valuable when working with large data sets, giving people the opportunity to study what might otherwise be incomprehensible. This map from YesYesNo was generated from runners contributing their tracking data.