
Graphing Functions (Teacher's Choice)
Your PlotPoint and set window scale procedures can be used for graphing functions as well as plotting data points, but you'll need to build a different graphing block that doesn't expect a list of points but instead takes a function as input and runs that function with varying values of x to generate points to plot.

+((()-(3))squared).png "Graph function (-5) + ( ( ( ) - (3) ) squared)")
Graph function will need to plot the function in your graphing window; so it needs to know where the stage is. It can get that information from your mouse's position on the stage, and you already have a tool (x value at stage coord) that will translate the mouse’s position appropriately.
This graphing program will work a little differently than some others that you may have seen; it will not graph the function automatically but will instead let you "draw" the graph on the stage by dragging your mouse across the stage to provide the function input (x) values.
PlotPoint can use .png) as x, and so can your function. Your function's output is
as x, and so can your function. Your function's output is PlotPoint's y. So you can call your function with that input, and use that value in PlotPoint.
with-inputs(x-value-at-stage-coordinate(mouse-x)).png)
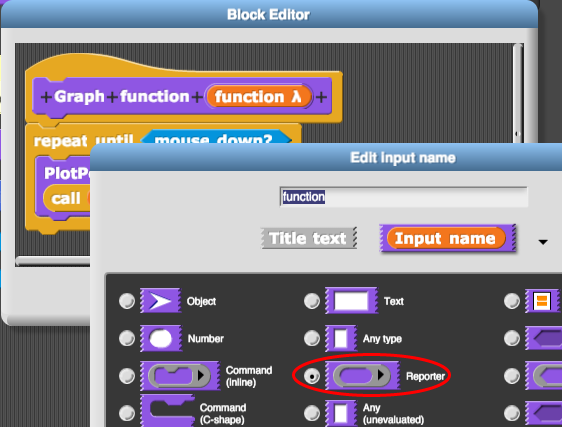
To give  a function as input, you must define it to expect a function as input:
- Build and try it out with any function you like, for example,
-plus-(()-plus-(-3))-squared.png) .
.
The block squared shown here is not a Snap! primitive (built-in block). If you want something like that, you will need to build it yourself.
Leave one slot in your function blank to indicate where the value of x will go.