

-
Play with the Snap! file
linked here to see a possible implementation of what you are trying to achieve with your the simulation. Before starting to program in Snap!, plan out the sequence of events that will occur in your simulation:
- When and how will the user input the desired number of flips?
- How will the program simulate the coin toss mathematically?
- How will the program simulate the coin toss visually? What will the user see?
- What are the variables to create in order to keep track of the important parameters in the simulation? When should these be initialized? When should they be updated?
- Use this starter project to build a Snap! program to run the simulation. It includes a sprite named “Coin” with two costumes (Heads and Tails) and a sound file (“Pop”) to get you started in your work.
-
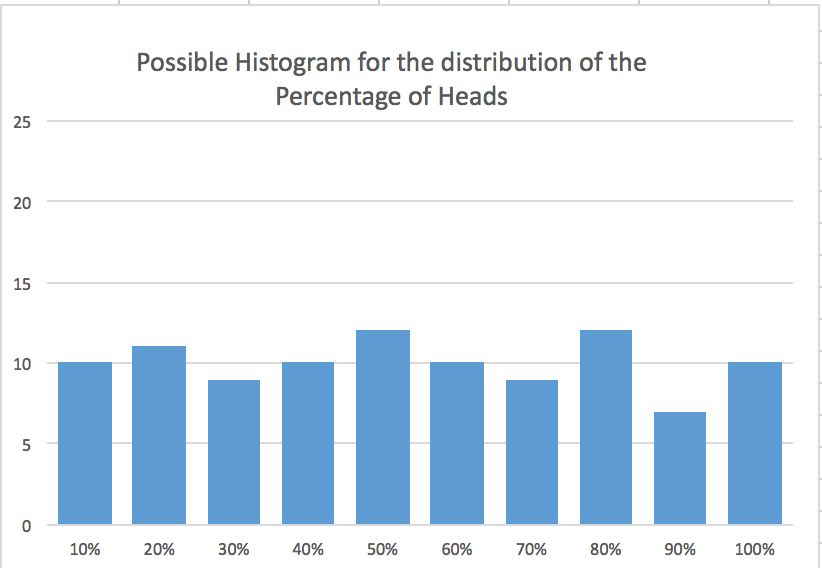
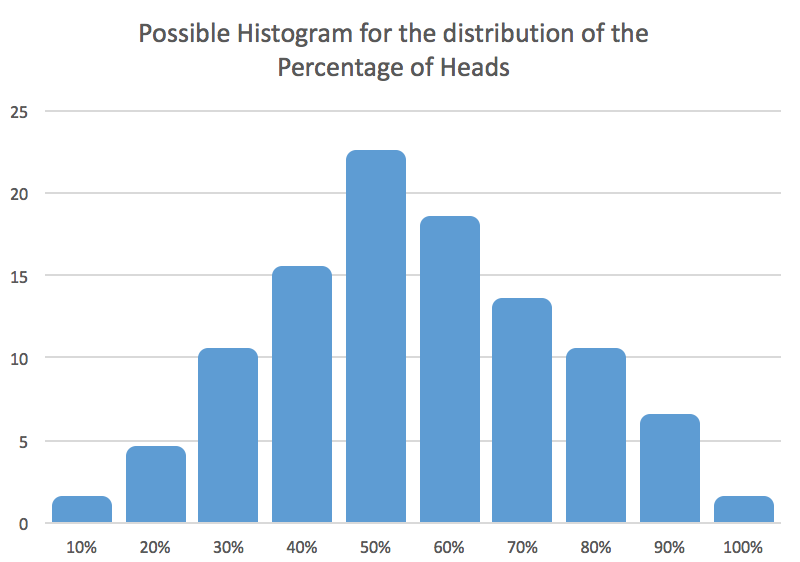
If you toss a coin 10 times and repeat this 10-toss trial many times, how likely do you think each possible percentage of heads will be across all trials? Here are two examples of possible distributions of the percentage of heads across many 10-toss trials. Which shape of a histogram do you expect in your class simulations?
- Use your program to simulate tossing a coin 10 times and record the percentage of heads that is observed. Combine your results as a class to graphically display the distribution of this percentage with a histogram. Are the results in accordance with what you predicted?
- If you were to repeat the above experiment but this time tossing the coin 100 times (doing 100-toss trials), how would you expect your histogram of percentage of heads to change? Test your hypothesis using your simulation and combining the results as a class.
Do this on your own but if you get stuck, you can visit this page for hints.