These need some work and will be better covered by the labs lost with the
HTTP block, which we will hopefully soon have back, but they need to go somewhere for now. --MF, 3/9/18
- LO 3.1.1 Find patterns, and test hypotheses about digitally processed information to gain insight and knowledge. [P4]
- LO 3.1.2 Collaborate when processing information to gain insight and knowledge. [P6]
- LO 3.2.2 Determine how large data sets impact the use of computational processes to discover information and knowledge. [P3]
ST EK List:
3.1.2E Collaborating face-to-face and using online collaborative tools can facilitate processing information to gain insight and knowledge.
3.1.2F Investigating large data sets collaboratively can lead to insight and knowledge not obtained when working alone.
3.2.1A Large data sets provide opportunities and challenges for extracting information and knowledge.
3.2.1B Large data sets provide opportunities for identifying trends, making connections in data, and solving problems.
3.2.1C Computing tools facilitate the discovery of connections in information within large data sets.
3.2.1D Search tools are essential for efficiently finding information.
3.2.1E Information filtering systems are important tools for finding information and recognizing patterns in the information.
3.2.2A Large data sets include data such as transactions, measurements, text, sound, images, and video.
3.2.2B The storing, processing, and curating of large data sets is challenging.
3.2.2C Structuring large data sets for analysis can be challenging.
3.2.2G The effective use of large data sets requires computational solutions.
Analyzing U.S. Baby Names
EK 1.3.1E in the baby name thing. --bh
1.3.1E Computing enables creative exploration of both real and virtual phenomena.
EKs covered: 3.1.2F, 3.2.1A, 3.2.1B, 3.2.1C, 3.2.2A, 3.2.2B, 3.2.2C, 3.2.2D, 3.2.2G
7.2.1B Scientific computing has enabled innovation in science and business.
7.2.1C Computing enables innovation by providing access to and sharing of information.
On this page, you will learn about the visualization of large data sets.
What about data with millions of pieces of information, instead of a few hundred? Large data sets present challenges and opportunities for discovering new information.

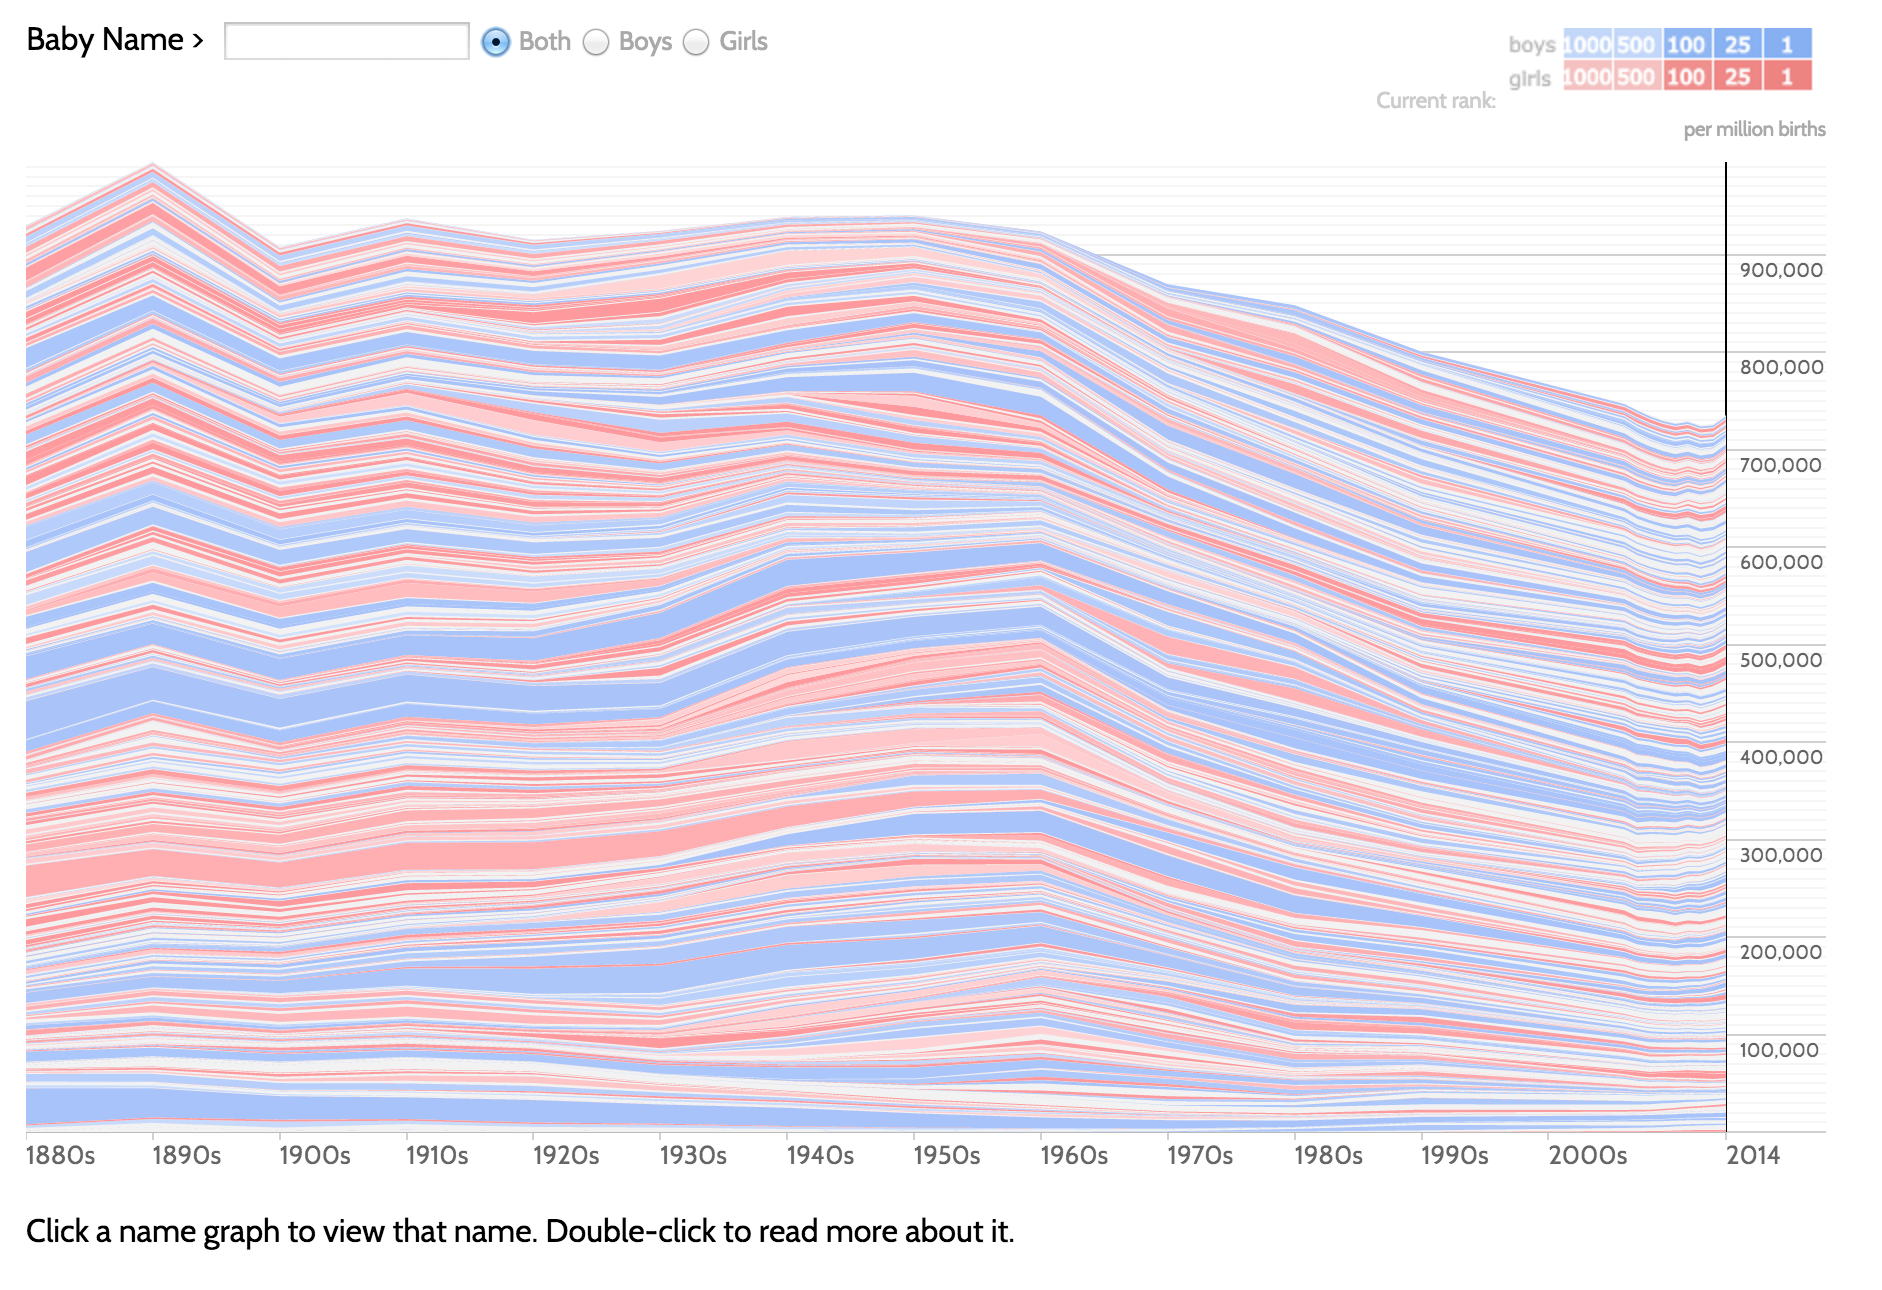
- Using a Web browser, open the Baby Name Voyager. This visualization shows the 1000 most popular names of boys and girls born in the United States for every year from 1880 to 2014.
If the graph becomes unresponsive or blank, reload it.
- What was the most popular girl's name in the 1900s? In the 1960s?
- What boys' names are much less popular today than they were in 1880?
- Type in what you think is the most popular name in your school. Is this name still popular for new babies?
- What else can you find? Find some interesting information in the data, then prepare to show it to your class.
- Did you have trouble answering any of these questions? What, if anything, doesn't this visualization do well? How might you improve it?
The Baby Name Voyager is an impressive visualization of a large data set. This data comes from the Social Security Administration, a text file for each year from 1880 to 2014. Very few of the insights in this data would be learned just from reading these files!
Large data sets present unique challenges and opportunities:
Visualizations and interactive tools are especially valuable when working with large data sets, giving people the opportunity to study what might otherwise be incomprehensible. This map from YesYesNo was generated from runners contributing their tracking data.
- Work with the Social Security birth data to produce a visualization of your own. You can start with this 2014 data, with other years' data available here to download.
- Think of a large data source you've produced, and visualize it using Snap!. Remember, large data sets can include text, sound, images, and video.
 when working with large data sets, giving people the opportunity to study what might otherwise be incomprehensible. This map from YesYesNo was generated from runners contributing their tracking data.
 when working with large data sets, giving people the opportunity to study what might otherwise be incomprehensible. This map from YesYesNo was generated from runners contributing their tracking data.