Disease Spread Project
- EK 1.3.1E Computing enables creative exploration of both real and virtual phenomena.
- EU 2.3 Models and simulations use abstraction to generate new understanding and knowledge.
LO 2.3.1: using a model of a population and simulating interactions among that population.
- LO 2.3.1 Use models and simulations to represent phenomena. [P3]
- EK 2.3.1A Models and simulations are simplified representations of more complex objects or phenomena.
- EK 2.3.1B Models may use different abstractions or levels of abstraction depending on the objects or phenomena being posed.
- EK 2.3.1C Models often omit unnecessary features of the objects or phenomena that are being modeled.
- EK 2.3.1D Simulations mimic real world events without the cost or danger of building and testing the phenomena in the real world.
LO 2.3.2 is in #1, 4, and 5
- LO 2.3.2 Use models and simulations to formulate, refine, and test hypotheses. [P3]
- EK 2.3.2A Models and simulations facilitate the formulation and refinement of hypotheses related to the objects or phenomena under consideration.
- EK 2.3.2B Hypotheses are formulated to explain the objects or phenomena being modeled.
- EK 2.3.2C Hypotheses are refined by examining the insights that models and simulations provide into the objects or phenomena.
- EK 2.3.2D The results of simulations may generate new knowledge and new hypotheses related to the phenomena being modeled.
- EK 2.3.2E Simulations allow hypotheses to be tested without the constraints of the real world.
- EK 2.3.2F Simulations can facilitate extensive and rapid testing of models.
- EK 2.3.2G The time required for simulations is impacted by the level of detail and quality of the models, and the software and hardware used for the simulation.
- EK 2.3.2H Rapid and extensive testing allows models to be changed to accurately reflect the objects or phenomena being modeled.
Brian wants to do something with a real example (like weather modeling). --MF, 2/20/18
On this page, you will model the spread of a disease in a population.
![Simulation of a disease spreading in a population. A single infected individual eventually causes everyone to be infected. Simulation of a disease spreading in a population. A single infected individual eventually causes everyone to be infected.]()
Suppose you are a medical researcher at the Centers for Disease Control (CDC) and would like to understand the factors that contribute to the spreading of a new disease across a population. In particular, you would like to know the effect of population size on the rate at which the disease spreads.
- What would be a sensible hypothesis on how population size relates to the rate of the spread of the disease?
You may not have enough data from actual outbreaks to test your hypothesis and make any meaningful conclusions, and it would be unethical to induce the disease in some population in order to gather new data. In this situation, a simulation would be the best option to generate data in order to test your hypotheses without the constraints of time, cost, and ethics.
In this project, you will simulate the spread of a disease within a small population and explore the effects of variables such as population size and speed of human interaction on the spread of disease.
- Play with the Snap! file
linked here to get a feel for the simulation program you will be writing.
-
Your code should:
- Discuss how your simulation may be similar to and different from a real life disease outbreak. Identify the simplifying assumptions you made in this simulation.
-
Study the relationships between the various variables in the simulation:
- the population size
- the percentage of the population initially sick (percent initially sick)
- the speed at which the people move
- time elapsed (at the point when the entire population becomes sick)
Brian, I made light edits to the following line and I split off the end of #5 into a new <li>; if you agree, this changes needs to be made to the solution file too. Also, the solution file still has single-letter variables in it toward the end. --MF, 2/22/18
Create a hypothesis predicting the pattern(s) that will emerge in the simulations.
For example, to understand the effect of the population size on the time it takes the disease to fully spread (time elapsed), you might fix population size at 10 and speed at 2, and use your simulation to make a chart of time elapsed (on the vertical axes) as a function of population size (on the horizontal axis) in increments of 10 for population size.
Perform similar experiments to understand the effect of initial percentage of the sick and to understand the effect of agent speed.
Since the results of each run are partly random, you may need to run each particular simulation several times and take an average.
- Create a visual graph of your findings. Do you see any patterns? Do they agree with your hypothesis? If not, make a new hypothesis. How can you study the effects of other variables with your simulations?
This is a simplified model. There are many things you could do to make the model more realistic. For example, you could make the infected people heal over time, or you could add doctor sprites who can heal sick sprites. But if you included all the things that happen in real human populations in your simulation, it would slow down the simulation too much to use. Updating your software or upgrading your hardware may help you include more details in your simulation, but you will always have to make some simplifications.
There was a time when weather scientists could do a good job of predicting the weather with a complicated model. The only problem was that the computers back then took several days to run the model, so the predictions weren't ready in time. Computers these days can run many complicated weather models fast enough to predict the weather reasonably well.
-
Here are some possible variations on this simulation that could make it more realistic. Save a copy of your work before exploring one or more of these variations:
- Give a probability to being infected when a healthy person encounters a sick person.
- Let the infected people slow down in speed.
- Let the infected people heal either with time or by a probability.
- Let those infected and then healed become immune to the sickness.
- Introduce doctor sprites that heal the sick upon encounter.
- At the start of simulation, introduce vaccination to a given percentage of the population.
- Design and implement a predator-prey simulation in Snap!. For example, you could model an environment with wolf and deer populations where the wolf prey on the deer. What are some parameters you need to incorporate into your model so you can simulate realistic fluctuations in the populations of predator and prey?
-
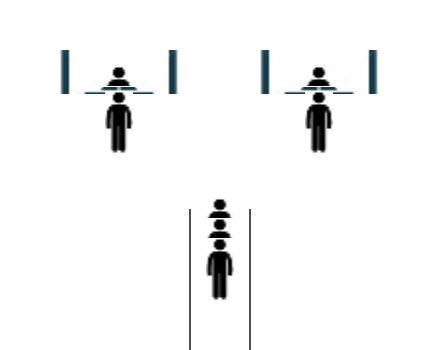
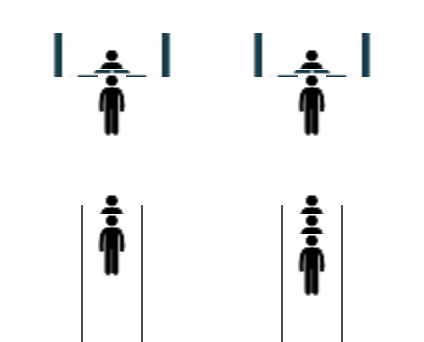
Imagine you work at a bank that wants to minimize customer wait times in line. The bank is considering two alternatives:
- a single line where the customers stand in arrival order and wait for the next available teller, or
- separate lines for each teller.
Design and implement two simulations in Snap! to help the bank determine the average wait time for customers in each scenario in order to choose the best option.


