Introduction
- Import these GPS coordinates, which describe locations on the Earth.
Not having read the lab that we don't have yet before this, I have no idea how this import is going to happen. Are they going to import data from a file? ;) MF
In each coordinate pair, the first number is the latitude (north-south), and the second number is the longitude (east-west).

Positive values of latitude are north of the Equator, negative values are south. Positive values of longitude are east of the Prime Meridian (through London), negative values are west.
For example, if you search for "40.7488051,-73.9854167" in Google Maps (or Google Earth), you'll see the corresponding location, near the Empire State Building.
Include a 2D map of that locaton with lat and long clearly marked to make it clear WHY we reverse the order. --MF
Note when writing GPS coordinates, the convention is that the first number is latitude, the north-south measurement, and the second, longitude, is measures east-west. $$latitude, longitude$$ $$40.7488051,-73.9854167$$ However, when plotting GPS coordinates, the convention is that longitude, which is plotted on the horizontal x-axis, is first, and latitude, which is measures vertical location on the y-axis is second. $$(longitude, latitude)$$ $$(-73.9854167, 40.7488051) $$ When plotting GPS coordinates, plot them as (longitude, latitude), reversing the written order.
Making the data useful
GPS data isn't very useful as a list of numbers; the data is far more useful if we can visualize it. Here are the coordinates as a list of lists:

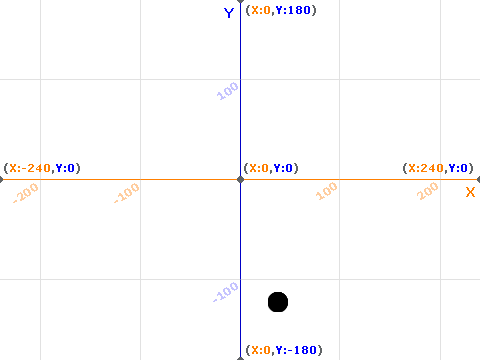
When you open the project, you will see that the background of the stage is set to an x-y grid and that the sprite's costume is a black circle.
-
Write a script to plot the coordinates on the graph. Use
stamp to plot the points.
When you run your script, you should see this (need to fix this):
Remember, plot the longitude first, then the latitude.

 Why can't you see all the points?
Transform the data
You can do it your own way instead if you like.
To display all the points, you'll need to transform them. These problems will lead you through one way to do this.
Subtracting -74 is the same as adding 74.
- Every point's longitude is around -74 and every point's latitude is around 40. This does not help us tell the points apart. Subtract -74 from every x-coordinate and subtract 40 from every y-coordinate, using a higher-order function.
- Now the first x-coordinate is BLAH. There are many choices we could make to turn this into a "nicer" number. One choice is to multiply every x- and y-coordinate by BLAH. Adjust your higher-order function to do this calculation as well.
Making Snap! do the work is better, because then the program can be used on any set of GPS points in this area, and not just these. That's abstraction.
- Now the first x-coordinate is BLAH, which we still can't see on the grid. Let's center the coordinates around the average x- and y-coordinate. Subtract the average of all the x values from each of the x-coordinates, and subtract the average of all the y values from each of the y-coordinates. Make Snap! do the work.
- Once you have these transformed coordinates, use your script from problem 1 to plot the points.


