Importing and Accessing Data
Add somewhere: "you can double-click on a list watcher to open it in a dialog box which you can then keep around..." --Jens SnapCon 2023
DAT-2.D.1, DAT-2.C.1
Computers can be useful in processing data to gain information, but your ability process data depends both on your capabilities and the tools you have available.
On this page, you will build various tools (specifically, selectors) to help you answer questions about data that interests you.
"U5L3-Data-Processing"
-
Visit the CORGIS Datasets Project or Tableau Sample Data Sets and select a dataset you'd like to explore. Download the CSV file for the data you want to explore.
Snap! allows you to import data in the CSV format. You can convert an XLS or XLSX file into a CSV: open it in a spreadsheet program (such as Google Sheets), and download it as a CSV so you can drag that into Snap!. The Tableau website also has JSON, PDF, and ZIP files; these are harder to process and are not recommended for this lab.
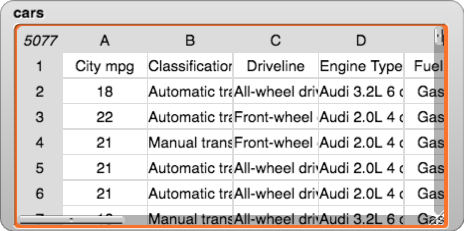
- Open Snap! and drag the downloaded file into the Snap! window. You should see a table full of data. Look over the data (including the column headings in the top row) to give yourself a sense of what kind of information is included. Then click "OK" to close the window. You can still see the data in the watcher on the Snap! stage.
DAT-2.D.5
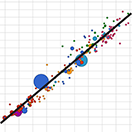
 You may be familiar with tables from spreadsheet applications (such as Google Sheets, Apple Numbers, or Microsoft Excel) which store tabular data in different file formats. Spreadsheet programs help efficiently organize information, and they can find trends in data automatically (such as the line shown at right). CSV is an open spreadsheet format that works in any of these applications and in Snap!.
What does CSV stand for?
CSV stands for "comma separated values." CSV files are tables of data stored with commas between each item in a row and line breaks between each row in the table. (You can see the commas and line breaks of a CSV by opening it in a text editor.)
Although spreadsheets are a common kind of data, they aren't the only kind. Consider the list of words that you used in Lab 1 to check spelling. It's not a list of lists with two dimensions of data (rows and columns); it's just a list with one dimension of data. "Spreadsheet" refers to two-dimensional data organized in rows and columns. "Dataset" is the more general term for any collection of data, including simple, one-dimensional lists; spreadsheets (two-dimensional lists of lists); and more complicated datasets such as spreadsheets with multiple tabs.
- Experiment with different inputs to the
 block to access different rows in the dataset.
 How does the first item of your data set (
item (1) of) differ from the other items?- Locate the
 block and determine what it does with your data.
-
Build selectors:
 that reports just the headings in a table
 that reports just the data (not the headings)
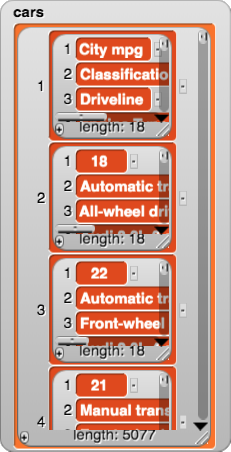
A table is represented in Snap! as a list of lists. If you right-click (or control-click on a Mac) a table, you can switch to "list view" and see how the data (and column headings) are stored. See examples of table view and list view.
:
Records,
Fields, and
Columns
- A record is one row in a dataset (other than the first row, which contains the column headings). A single record might be the data for one student in your school, the data for one earthquake that happened, the data for one hospital in the U.S, or the data for one contact in your contact list. In other words, a record is a horizontal slice of the dataset.
- A field is one item of a record in a dataset. It might be one person's homeroom teacher, the magnitude of an earthquake in Los Angeles last week, the owner of one hospital in Chicago, or the phone number of one person in your contact list.
- A column is a list containing the data from one field for all records in a dataset. A column might be the homeroom teacher for every student in your school, the magnitude of every earthquake in the dataset, the owner of every hospital in the U.S., or the phone number of every person in your contact list. In other words, a column is a vertical slice of the dataset.
![three frame animation of the report of cars dataset displayed as a table with columns and rows; in the first frame, the fourth row of the table is highlighted and labeled 'record (row)'; in the second frame, the third column of the table is highlighted and labeled 'column'; in the third frame, the cell in the fourth row and third column is hightlighted and labeled 'field' three frame animation of the report of cars dataset displayed as a table with columns and rows; in the first frame, the fourth row of the table is highlighted and labeled 'record (row)'; in the second frame, the third column of the table is highlighted and labeled 'column'; in the third frame, the cell in the fourth row and third column is highlighted and labeled 'field']()
- Build
 and
and  blocks to make it easier to think about the structure of the table.
-
 Build
Build  to report just one column of your dataset.
Record and column are selectors for a table abstract data type. We don't need a constructor for this abstract data type because we are importing the data from the Internet, but the selectors will be useful. (Field is a selector for record, which is, itself, an abstract data type.)
Notice that these suggested block names include the word "table" or "record" before the second input. Including the expected input data type in the block name can help you avoid bugs caused by using a selector that doesn't match the input you want to use.
Try to figure out how to report just one column, but click if you really need a hint.
-
 Determine one question you can answer by looking at a single column of your data set, and then build code to answer your question. You may need to build additional blocks or import them from other projects.
You can see the column number by holding your mouse pointer over the letter at the top of the column in table view.

You may need to use map, keep, or combine to answer your question. Click to see where you learned about these higher order functions.
Click for example questions to ask about a single column.
- What's the average MPG that cars in this database get in the city? (You'd need an
average block.)
- What's the year of the oldest car in this dataset? (You'd need a
minimum block.)
- How many cars in this dataset have manual transmission?
Notice that all of these examples only require data from one column. If you want to ask a question that requires looking at another column (for example, "What's the model of the car with the highest MPG?"), you can do the Take It Further Activity below.
Challenges in Collecting Data
This section looks long. We should do another pass to trim it down. --MF, 4/4/20
DAT-2.C.3, DAT-2.C.2 all bullets
Researchers often face challenges with data before they even begin analysis. Suppose you are combining data from different countries about distances between cities, and you discover that the distance data from the U.S. is measured in miles, but the distance data from Europe is measured in kilometers; to make meaningful comparisons, you need uniform data (all in miles or all in kilometers). As another example, if you use an online survey to collect data, the way participants abbreviate, spell, or capitalize their entries may vary. Data may also be incomplete (if some people didn't complete the survey) or invalid (if some people made mistakes).
:
Cleaning Data
DAT-2.C.4, DAT-2.E.2
Cleaning data is the process of making the data uniform without changing its meaning (such as replacing abbreviations, spellings, and capitalizations with the intended word or converting miles to kilometers). Programmers can use programs to filter and clean digital data, thereby gaining insight and knowledge.
DAT-2.C.5
Imagine you read in the news that people who eat a lot of broccoli are less likely to get cancer. The conclusion that broccoli prevents cancer could be a result of bias. It could be that people who eat a lot of broccoli tend to be the same people who also get a lot of exercise, and it's actually the exercise that makes the difference. In research, the term "bias" doesn't have to mean prejudice; it's about reasons the data might not mean what they seem to mean.
People sometimes think that the way to overcome bias is to use a bigger sample (asking more people if they eat broccoli and have cancer). But if the bigger sample has the same problem (people getting more exercise also eat more broccoli), then a bigger sample won't eliminate the bias.
-
DAT-2.C
 Describe possible challenges about the data you might face if you were going to collect your own data to answer a question like the one you investigated in the previous problem.
I need to redo these images and code statements with "record" instead of "row." --MF, 6/27/19
- Answer a question like "What's the model of the car with the highest MPG?" by building a
 block.
-
Writing specific field numbers into the code is problematic for several reasons: It's easy to get wrong, it makes for unreadable code, and (this actually happened with the cars database between edits of BJC) the layout of a table might change over time.
- Write a block
 that looks for the given name in the table header , finds what item number it is in the header list, and uses that as the field number to extract from the given record.
- Also write
 , which should take the full table (header and data) as input, but should report the desired column from only the data of the table (so that the result can be used directly as input to blocks such as AVERAGE OF LIST).
- You may find
 helpful.

 You may be familiar with tables from spreadsheet applications (such as Google Sheets, Apple Numbers, or Microsoft Excel) which store tabular data in different file formats. Spreadsheet programs help efficiently organize information, and they can find trends in data automatically (such as the line shown at right). CSV is an open spreadsheet format that works in any of these applications and in Snap!.
 block to access different rows in the dataset.
 block and determine what it does with your data.
 that reports just the headings in a table
 that reports just the data (not the headings)

 and
and  blocks to make it easier to think about the structure of the table.
  to report just one column of your dataset.
 performs the same function on every item in a list.
 block.
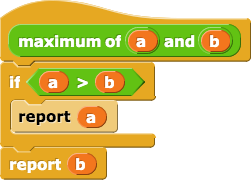
 function for a simple list (that isn't a table) is shown below. You can build a
  block that compares two inputs and use it with

 that compares a specific field (column) for two rows and reports the row with the higher value in the specified column.
 that looks for the given name in the table header , finds what item number it is in the header list, and uses that as the field number to extract from the given record.
 , which should take the full table (header and data) as input, but should report the desired column from only the data of the table (so that the result can be used directly as input to blocks such as AVERAGE OF LIST).
 helpful.