Analyzing Data
On this page, you will ask and answer more demanding questions about your dataset and learn new tools.
DAT-2.D.4
You can ask questions about a specific subset of your data by filtering the data using keep. Filtering is a powerful technique for finding information and recognizing patterns in data. For example, filtering can help you answer questions like "What is the average city MPG for just the Subarus in this dataset?"
 of table (keep items (field (14) of record 'empty list input slot' = Subaru) from (data of table (cars))) reporting 19.704...")
Column 14 is the "Make" of the vehicle, so we keep all the records from cars for which the 14th field is "Subaru." Then, we take column 9 of those records (the "City MPG") and find their average.
Notice that there are many digits in the answer above. How many digits are given in the table for each car's MPG? An important rule in data science is not to claim more precision in a result than is warranted by the given data, so this answer should be rounded to 19.
You might find expressions with many nested function calls easier to build by using the pipe function. What would this look like using pipe?
You can use the pipe function from the "Bar Charts" library to work through your data analysis one function at at time:
) → (keep items (field (14) of record 'list input slot' = Subaru) from 'list input slot') (column (9) of table ()) (average of ()) reporting 19.49...")
The pipe function sends the data from table (cars) through keep to filter it for just the Subarus, through column (9) of table to get just the "City MPG" for those Subarus, and finally through average to get the average of those Subaru MPG values.
Recall that the empty input slots in each function are filled by the output of the previous function (or the starting dataset in the case of the first function): the empty slots in the keep function are both filled by data from table (cars); the empty slot in column (9) of table is filled by the output of keep; and the empty slot in average is filled by the output of column (9) of table. It's like a pipe of made of pieces connected together; the data goes in one end and works through each function, computing a new value at each step.
- Open your U5L3-Data-Processing project if it isn't open already.
-
Add the tools you will need for this project:
- Load the "Bar Charts" library from the "Libraries..." option in the Snap! File menu (
 ).
).
- Import the
maximum of list, minimum of list, sum of list, and average of list blocks from your U2L4-MathTools project.
-
DAT-2.D
 Determine one question you can answer by looking at a single column of a portion of your data set, and then build code to answer that question. You can nest your function or use
 pipe. (Or try both!)
Click for example questions to ask about a portion of a single column.
- What's the average MPG that Volvos in this database get in the city? (You'd need
average.)
- What's the year of the oldest Honda in this dataset? (You'd need
minimum.)
- How many 2009 cars in this dataset have manual transmission?
Notice that the column you use to filter the data (such as year) doesn't have to be the column you are asking about (such as transmission).
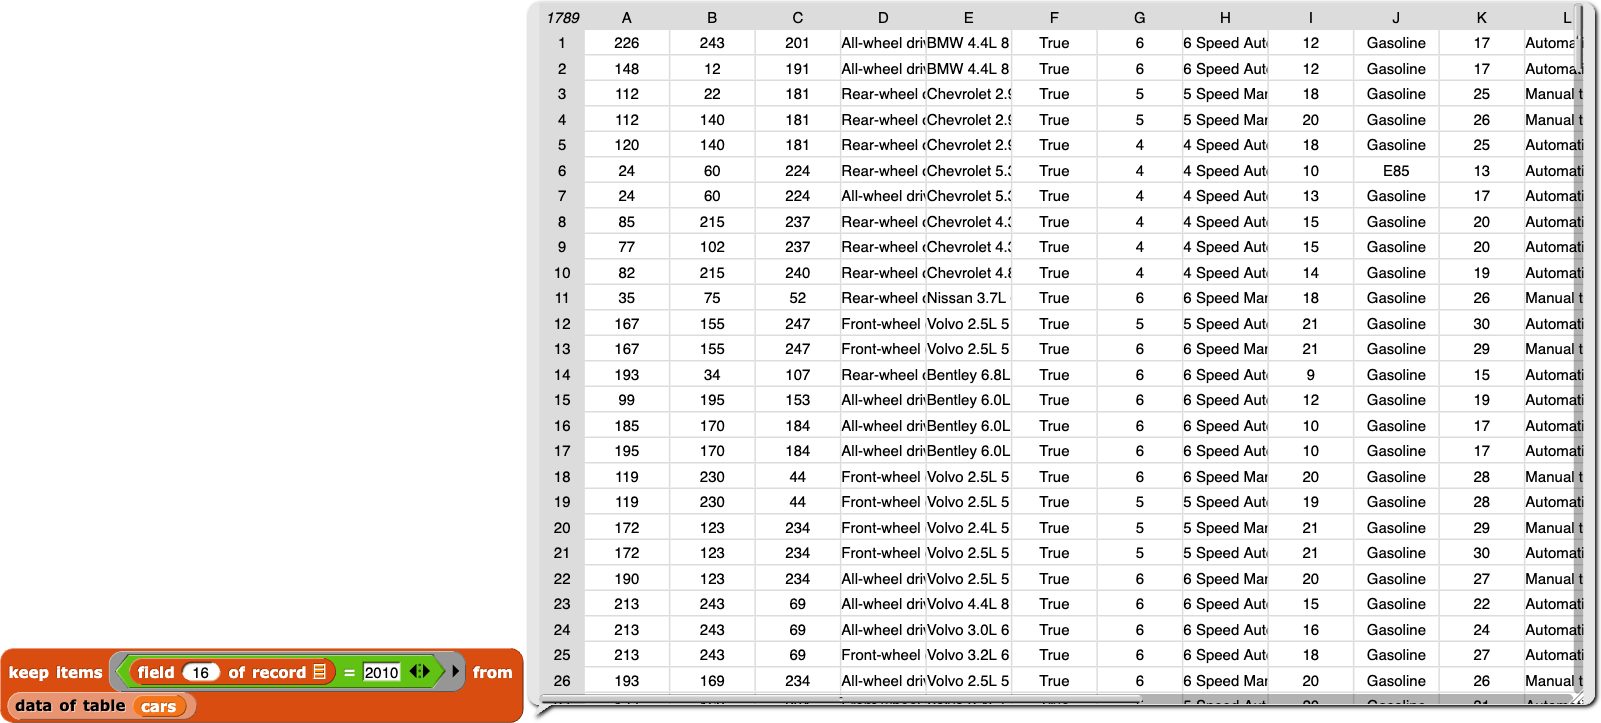
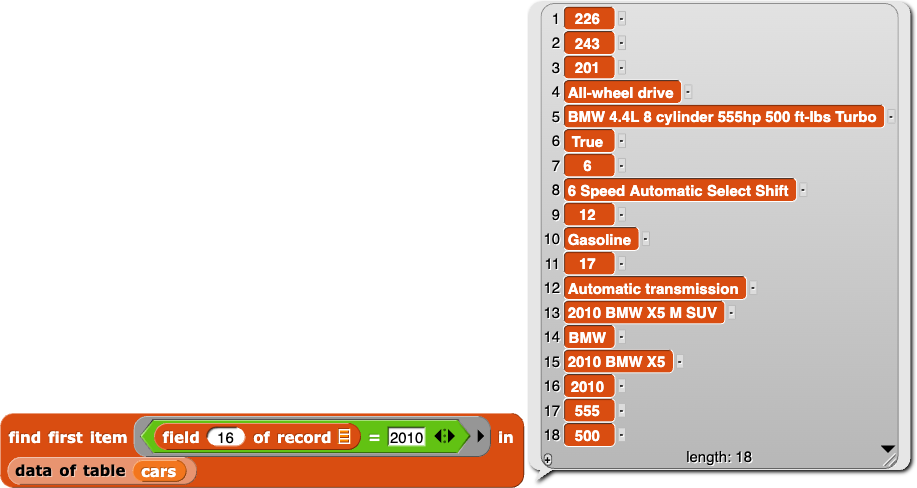
Sometimes, you want to keep a subset of your data (such as "Which cars were made in 2010?"), but other times, you just want one item that matches your requirement, often because what you really want to know is whether any items match, and as soon as you find one, the answer is "yes" (such as "Were any electric cars made in 2010?"). Snap! has a higher order function  in 'list input slot'") that works similarly to
that works similarly to keep, but it reports only the first item that's found, so it can be faster.
Find first is equivalent to item (1) of (keep). It is a higher order function like keep, map, and combine because it takes a function (a predicate) as input.
Images need alt/title text. --MF, 6/27/19 and new column numbers -bh
Click for an example of keep vs. find first.
DAT-2.D.6
You can access or change data to create new information by using:
Map to transform every element of a data set (such as doubling every element in a list, or extracting the parent’s email from every student record)Keep or find first to filter a data set (such as keeping only the positive numbers from a list, or keeping only students who signed up for band from a database of all students)Combine to combine or compare data in some way (such as adding up a list of numbers, or finding the student who has the highest GPA) - Visualization tools to present the data set in a chart, graph, or other visual representation (such as by using
bar chart, which you will learn on the next page)